California Ajax Solutions Team
www.CalAST.com
Chapter 3: Adding Styles and Other Reports
In this chapter, we will build on what we learned in the previous chapter to enhance our wine list. Then we will look at producing the inventory report from the same database.
Table Layout
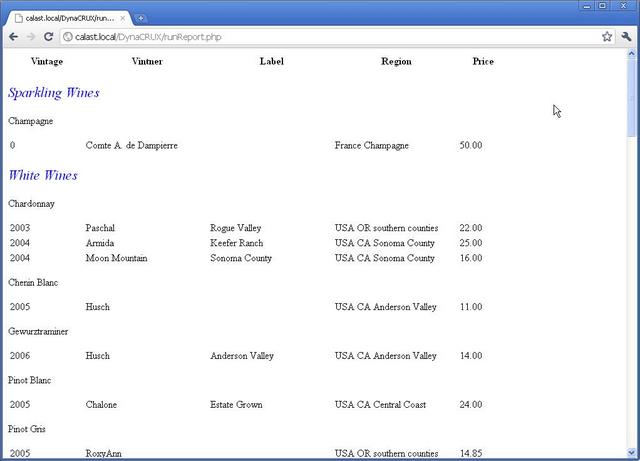
By default, DynaCRUX produces reports that are tables. The wine list in our example from the last chapter is obviously a table. In fact, it's really a series of tables, interrupted by grouping items. This is not the only way to do things, it's just the default. If you don't have groups, of course it is only one big table.
This can be a problem if you don't take steps to make things look the way you want. DynaCRUX uses your browser for display. Each browser has its own rules for how a table will be rendered, which is just another way of saying how the HTML "instructions" the browser sees are translated into a visual display. So two different browsers may show the same web page differently.
By default, tables are rendered based on content. That is, the column sizes are adjusted to fit the characters inside each table cell. Of course, the columns all line up (or tables would look awful) but the width of a column is based on the largest string of text the browser found for that column.
What happens if the strings get really big? Two things, depending on how the table is defined. The whole table can get wider, to the point where it's off your screen and you have to start scrolling to see it. If the strings contain spaces, then the row may be made taller and the string can be broken up into two or more lines. Both things can happen, as well.
Since DynaCRUX may produce multiple tables in the presence of grouping, this can be a real problem. The browser won't know they are all part of the same table, so it will render each one separately - and they won't line up. To fix this problem, you can override the default browser behavior by forcing the columns to all be the same size. This is expressed as a percentage of the table width. For example, you know the vintage year can never be more than four characters long, so you can make this be a small column. On the other hand, the vintner name, label, and region can be much wider.
In your report file, you can force column percentages to lay out the tables as you wish:
<item><xname>vintage</xname><colpct>11</colpct></item>
<item><xname>vintner</xname><colpct>26</colpct></item>
<item><xname>winename</xname><colpct>26</colpct></item>
<item><xname>region</xname><colpct>26</colpct></item>
<item><xname>marketvalue</xname><colpct>26</colpct><label>Price></label></item>
Of course, this is too much work for a complex report, so DynaCRUX will do this work for you if you use the automated tools.
The Schema Analyzer (described in the next chapter) can extract the width of table fields from your database, and pass them to the Template Builder. So the widths of all fields will be stored in your generated template file. The Report Builder application (see Chapter 5) has access to this information. When you choose a set of columns for display, it automatically calculates space allocation as a percentage of the total, based on maximum width. The generated report file will contain this information, and your browser will display it according to these rules.
Report Builder gives you many other choices about how tables are displayed. All this will be described later in this user guide.
Adding Style
While the report we produced in the past chapter was highly informative (assuming you were sitting in a restaurant trying to choose a wine for dinner), it was boring. This is an upscale restaurant - fast-food outlets don't generally have wine lists. So perhaps the patrons might like something nicer to look at. Besides, the owner just bought a new wireless ink jet printer that sits in the office, so we might as well use some color - at least until she finds out what ink cartridges cost.
We're going to take advantage of CSS (Cascading Style Sheets) to do this work. CSS is a really powerful tool. For the part of CSS called classes, you just make up a name for something, and tell the browser where to apply that name (which is mostly done for you by DynaCRUX). You define what that name means in a style sheet file. If you don't like the way it looks, you just leave the name alone and change the definition of that style to look the way you want. But since the name stays the same, you don't have to go around editing HTML or XML files to change the look and feel of your reports.
You don't need to have a deep understanding of CSS to use DynaCRUX, but a little basic knowledge can improve the look of your reports. We're going to create a file containing all the style information, and then use the names we define in that file to tell DynaCRUX how to apply styles. We'll call the file "chezmoi.css" and store everything we need in it. In practice, it's common to have more than one style sheet. For example, you might want one for layout (where things go) and one for appearance (what they look like).
Of course, we have to tell DynaCRUX to use this file for our wine list report, so we add a line to the report file:
<css>chezmoi.css</css>
Well, that was easy, but of course you have to create the file (or have your waiter do it). It's just a text file, and we'll try to keep it simple. We'll just built it one element at a time as we think of things to add. The first thing we want is to make the wine classes stand out a bit, so we'll print them in blue and italic font. So, what we have to do is invent a name for this - we'll call it cname. Then we need to define what cname looks like, and specify where to use it. The last part is easy - we'll modify the group specification to add a CSS class attribute. (Sorry about the fact that this is the wine class and we are assigning a CSS class - all these uses of the word "class" are bound to be confusing. It gets easier.) Note that this is not a child node. Since class is a common attribute in HTML, we do the same here. Attributes are just field-value pairs that appear as part of the a node's opening tag.
<item class="cname"><xname>wineclass></xname><group>1</group></item>
We will add a line to chezmoi.css that looks like this:
.cname {color:blue; font-style:italic; font-size:1.4em;}
This just says that the CSS class cname means the font should be blue, italic, and bigger. Let's take another look at the wine list with this change applied:
Clearly, this makes the grouping stand out more. You can also apply a style to the second level grouping (varietal) if you like, or make the wine class group name centered. DynaCRUX just applies the style for you - you can define it any way you want, and you can modify your CSS file without changing anything in your database or report definition. You will probably want a title for your wine list, as well.
One more issue we should discuss is data alignment. (No one said web design was easy). Data is aligned within a column according to browser default rules. In our case, we want to override these rules to force the price column to line up. We do this by making that column be right-justified. If all of our wines were priced from $10.00 to $99.99 then it would not matter. But if we had an inexpensive wine (well, that won't happen in a good restaurant) or a really expensive wine on our list, then the alignment won't look right unless the decimal points line up.
While in theory it is possible to specify such an alignment-by-character in HTML, no current browser honors that particular rule. But it does not matter here, since we can simply assign a class that forces right justification of that column, and all will be well.
Let's make those changes. First, add a line to the report file presentation section to specify the report title.
<title class="title">The Wine List of Chez Moi</title>
If you don't specify a named class, the title will just default to the HTML <h1> element, as interpreted by your browser defaults - unless you also specify a style for the <h1> tag. If you do specify a name, then it has to be added to your CSS file, so let's update that file to add the title, change the centering of wine classes, add a style for varietals, and add the right justification rule.
.title {color:black; font-family:"Times New Roman, Times, serif";
font-style:normal; font-weight:bold; font-size:large; text-align:center}
.cname {color:blue; font-style:italic; text-align:center;
font-size:1.4em;}
.vname {color:black; font-style:normal; font-weight:bold;
font-size:1.2em;}
.rjust {text-align:right}
Here, vname is the name of the second level grouping CSS class (varietal), so make sure this is noted in your report definition. The second group entry now looks like this:
<item class="vname"><xname>varietal</xname><group>2</group></item>
Finally, we'll modify our item descriptor for the Price column to add the CSS class:
<item class="rjust"><xname>marketvalue</xname><colpct>26</colpct><label>Price></label></item>
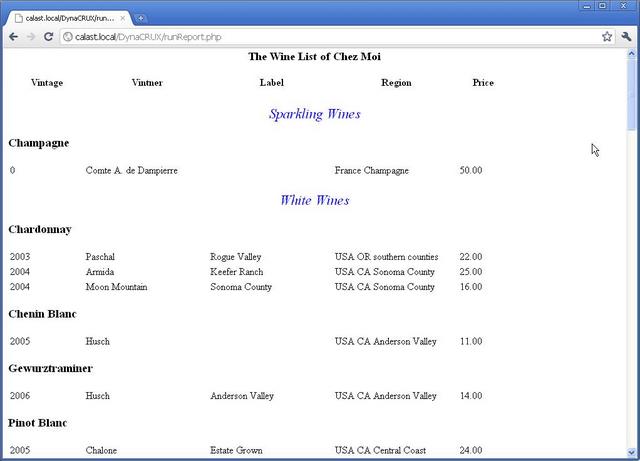
While still far from beautiful, the grouping is now more obvious and we have a title. We're making progress. Let's just declare this to be good enough for our purposes.
The Inventory Report
While our wine list report will help us sell lots of wine to diners, that just means we're going to run out. So we better have a management report that lets us know how our inventory is doing. We're going to add one more table to the database to store the location of each wine, which will help us do a visual inspection. If our database says we have ten bottles and we can only find eight, we might suspect the dishwasher was having an after-hours party. Thus, we will arrange this report by location. Of course, if you only had one location, then you could arrange this in some other way. There's no limit to the number of report definitions you can come up with. They don't take up much space.
Locations are stored a table we haven't shown you before. It's so simple we should not need to generate another database diagram. It just contains LocationID as a primary key and Location as a string describing the name of the location. The winelist table already has a foreign key (also called LocationID) that references the Location table, so our data model is set.
This report is for management use, so we won't worry about style so much as content. Here's the definition of the inventory report:
<?xml version="1.0"
encoding="utf-8" ?>
<!DOCTYPE report SYSTEM "report.dtd">
<report version="2"><template>winelistGen.xml</template>
<page>default.html</page>
<title div="dcxTitle" class="title">Inventory</title>
<css>chezmoi.css</css>
<!-- Datasets section -->
<dataset id="primary"><dstype colopt="browser">table</dstype>
<div>dcxPDS</div>
<usesfilter value="1">instock</usesfilter>
<item><xname>cellarloc</xname>
<sort direction="asc">1</sort>
<group>1</group>
<width>20</width>
<format>text</format>
<label>CellarLoc</label>
</item>
<item><xname>varietalname</xname>
<sort direction="asc">3</sort>
<column>2</column>
<width>30</width>
<format>text</format>
<label>VarietalName</label>
</item>
<item><xname>vintner</xname>
<sort direction="asc">4</sort>
<column>3</column>
<width>30</width>
<format>text</format>
<label>Vintner</label>
</item>
<item><xname>winename</xname>
<column>4</column>
<width>30</width>
<format>text</format>
<label>WineName</label>
</item>
<item><xname>vintage</xname>
<sort direction="asc">2</sort>
<column>1</column>
<width>6</width>
<format>text</format>
<label>Vintage</label>
</item>
<item><xname>stockonhand</xname>
<column>5</column>
<width>6</width>
<format>text</format>
<label>StockOnHand</label>
</item>
</dataset>
<dataset id="summary"><dstype colopt="browser">list</dstype>
<div>dcxSDS</div>
<usesfilter value="1">instock</usesfilter>
<item><xname>countwines</xname>
<column>1</column>
<format>text</format>
<label>Total Wines</label>
</item>
<item><xname>countvintners</xname>
<column>2</column>
<format>text</format>
<label>Total Vintners</label>
</item>
<item><xname>countregions</xname>
<column>3</column>
<format>text</format>
<label>Total Regions</label>
</item>
</dataset>
</report>
This is somewhat similar to the wine list, in that there are no controls and the instock filter is required. Here, we sort on a new element called cellarloc and a few other fields, and we include enough information to uniquely identify the wine. We don't care about price, but we do care about how many bottles we have, so we add stockonhand as a column. In this report, we specify group by location only.
Additional Datasets and Synthetics
We have also added another new feature to the report - another dataset. Normally, database results come back looking somewhat like a table or a spreadsheet. It does not matter how you choose to display them - the structure of the data (remember, this is called a result set) always looks a lot like a table. There will be one line per "record" corresponding to a row in the table.
In DynaCRUX, a report can have as many datasets as you like. So in this case, we also want a wine cellar statistics dataset that summarizes the contents of the cellar - how many bottles, how many different varietals, etc. In the above report, this is called summary because it was added by hand. If the convert web application was used, the default name is dcxSDS (for DynaCRUX summary dataset). There are other uses for additional datasets that are easy to come up with. For instance, if you were printing invoices, you would have one line per billable item, but there would only be one customer name, no matter how many line items are on the invoice. So the customer name and address could be part of another dataset.
While some parts of a report file apply to the entire report, each dataset has its own attributes. In addition to such things as style, each dataset has its own items list and its own filters. Sometimes the filters will be the same, as in the inventory report. We are only interested in wines in stock for an inventory, whether we are listing them or counting them. But something like an invoice is likely to access a number of different tables, and each query may have very different filters.
In this report, the items in the second dataset are not elements. Clearly, they are being used to count things in the various tables, so the counts are not going to be in the tables themselves. But databases are very good at counting things, so we can use that power to obtain the information - all we need to do is define these terms in the template file. This introduces a new class of object called synthetic objects. So this report will include both elements and synthetics.
Let's take a look at how synthetics are defined in a template.
<object>
<type>synthetic</type>
<displayname>Total Bottles</displayname>
<xmlname>countstock</xmlname>
<table>winelist</table>
<query>sum(StockOnHand) as countstock</query>
</object>
This does not look so different from an element, except for the type being different. It still has a display name and an xml name, but there's no query name - because it isn't in a table. Instead, it has a query that tells the database how to obtain a value. Here, we tell the database to add up all the values of the field StockOnHand (subject to other conditions, like filtering) and call it countstock - the xml name. Now the database knows how to find and return the answer.
All the items in this second dataset are of this form, but synthetic objects can be used anywhere elements are used. Any time you need to calculate something instead of finding it in a database table, you use a synthetic. You are not limited to counting things, of course. You could find the largest or smallest value, or the average value.
Here's another unrelated example of how a synthetic could be used. Suppose you are running a dental office and you have a database to schedule patient visits to one of your hygienists. You have time stamps for when an appointment was requested, when it was assigned, when it was cancelled, and when it was completed. Suppose you want to know the status of an appointment. You don't really need a field in a table for this, because it can be determined by looking at the time stamps:
- It there is a canceled time, then the status is canceled
- Otherwise, if there is no assignment time, then the status is unassigned
- If there is an assignment time but no completed time, the status is assigned
- If there is a completed time, the status is done
So, you could define a synthetic to return this information and use it in a report, just as if it really existed as a field in a table.
At this, point, you are probably wondering how synthetics are added to your template file, since it seems like a good deal of work to come up with them. DynaCRUX cannot "invent" synthetics, of course - you need to provide them. But if you have a good idea of what you will need (remember the "design on paper first" part?), the Template Builder application can lead you through the steps of creating these synthetics. We'll address this in the next chapter.
DynaCRUX has other object types that we will tell you about, but introducing one per chapter is quite enough.
Since you now understand a bit about what reports look like and how they work, it's time to look at how you can use the DynaCRUX built-in applications to build your template for you. This is described in Chapter 4: The Template Builder.