California Ajax Solutions Team
www.CalAST.com
This article describes the CalAST report generator technology, and how it may be used to create a web-based facility for user-customized reports.
Introduction
A popular feature of many software applications is the ability to create custom reports for management, based on the data in the system. This kind of capability is not often found in web applications, even those associated with databases. It is not clear why this is the case, since web applications are not fundamentally different from desktop applications. Probably, the lack of this feature is due to it being missing from the specification of the web app (where such a thing exists) and the lack of standard, off-the-shelf components for building a report generator into a web app.
However, report generators are quite useful, and I have found occasion to add them to a number of sites. Being somewhat obsessive about code reuse, I have attempted to standardize this implementation so as to make it a simple extension to an existing web app.
Let's start out by defining what we mean by a report generator. Any database contains a number of fields, corresponding to the columns of one or more tables. The contents of these fields may be summarized in a report to give users (management, customers, etc.) a summary of what information is in the database. An application may define these reports by hard-coding them into the application itself. But a much-appreciated variant is to allow the people who want to look at the summary to define their own report formats. If a report is often used - perhaps covering data for different date ranges - then you want to allow the report format to be saved as a named format, and retrieved. This implies that the report formats themselves are stored in the database, although not associated with any particular "other" data.
As always, it's useful to provide an example to see what we mean. If you look at wine lists in restaurants, you will often see them arranged in a fairly conventional way. That is, wines are grouped by broad classes (white wines, red wines), then grouped again within each class by varietal (Cabernet Sauvignon, Pinot Noir, Syrah), then ordered by vintage year. Other information not used for this arrangement is also provided - such as the price they are going to charge you for a bottle.
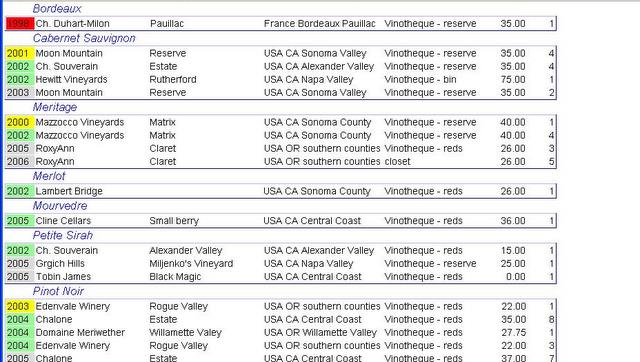
This illustrates some basic concepts of report generation. Grouping specifies which items have to be kept together, and separated from items in other groups. Sorting refers to the order things appear within a group. And including specifies what other information is to be included in the report about each item. There may be multiple items specified for each operation - such as group by wine class, then by varietal. Also, you can specify sort by vintage year, then by vintner. And, of course there are other operations as well as various flags that can modify what the report contains. So the user has a great deal of control as to what the report looks like.
Specifying the format
Being web designers, we don't want our users typing in some obscure, error-prone syntax to specify the report contents and format. We would much prefer to provide a graphical user interface for the user to define the report, then translate that to some easily parsed format for internal use. XML is an obvious candidate for internal storage, but JSON would work equally well, especially if all manipulation is to be done in JavaScript. The textual representation is necessary because we want to store and retrieve the report format in the database itself. We will return to that shortly, but we should start with the GUI representation, since that's what users will see.
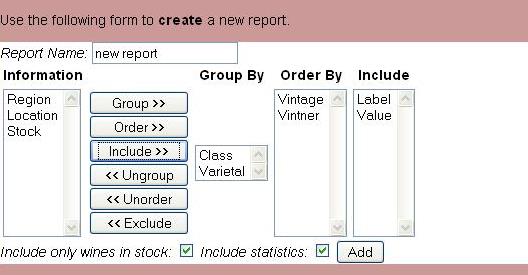
This form is used to define the reports for wine lists. Looking at it in a top-down way, we notice the following elements:
- A textbox for assigning a name to this report. This will be used to choose a report format when the user wants to create the report itself, populated with data from the database.
- A drop-down list called information that defines the fields available to be assigned to some function. Note that each item can be used for only one purpose. Items here have not yet been used.
- A group of buttons that move items (fields or columns) between the information list and the other lists. Moving an item to to another lists appends it - the order is important.
- A Group By drop-down list, that has been populated by two items that started out in the Information list. We will group by Class, and then subgroup by Vintner. Here, we allow only two levels.
- An Order By drop-down list, specifying that within a group and subgroup, we want to sort by Vintage, then by Vintner.
- An Include list that shows we wish to display Label and Value for each item, but not use them for grouping or sorting.
- Two checkboxes that set boolean values that modify the report contents.
- An Add button that saves the report in the database, usually associated with a user so each user can have his or her own set of defined reports.
When we initially see this form, all the items will be in the Information drop-down list, and the others will be empty. Te user selects an item from the Information list and uses the buttons with the right arrows to move it to one of the other lists. If a mistake is made, the item can be selected from the destination list and buttons with the left arrows can be used to move it back to the Information list. This process continues until the report is as desired, at which point it gets saved in the database using a text representation.
When the user wishes to generate the report, the selected format is retrieved from the database and used to generate a series of SQL queries to retrieve data, in this case about wines in stock. The web app then forms a display based on grouping, sorting, and including criteria, as show above. The names in the Information columns are usually used as column headers in the report, although the web designer can make a number of choices here.
Internal Representation
While the above graphical representation of a report is easy for the user to manipulate, it is not in an appropriate format to store in a database for later retrieval and use. Instead, we reduce the user's responses to a text form, and store them in the database. There are a few design decisions to be made here, and what you select has more to do with your own business model than the software technology.
The first question that should be asked is whether there will be one table for all the reports in the system, or will each user have his or her own table? The latter solution is used in the wine tracking site, because each user has his or her own database representing the user's wine cellar. The reports table is just another table in that database, along with the varietals table, the vintners table, and so on. But this is hardly typical. A more likely scenario is that there will be one table for all reports, and each will be associated with the user (e.g., customer) who gets to see those reports. This association is necessary because all users share the same database, but each user is allowed to specify report formats that no other user can access.
The second question to ask is if the choices are likely to change in the future. In the wine database, the reporting is so restrictive that it is very unlikely to change. Thus, we simply have fields (columns) for GroupBy, OrderBy, and Include. Within those columns, we store a comma-separated list. For example, the value of GroupBy in the above example would be 'Class,Varietal' and the value of OrderBy would be 'Vintage,Vintner'. This is a perfectly reasonable solution, but does not really allow for new elements to be added to the report options. And it would be more difficult to add a new feature, like summing the Value columns.
For this reason, we prefer to allow for more flexibility by defining the report in a structure meta-language like XML. In XML, the above specification could be represented as follows:
<report>
<name>new report</name>
<group>
<item>Class</item>
<item>Varietal</item>
</group>
<order>
<item>Vintage</item>
<item>Vintner</item>
</order>
<include>
<item>Label</item>
<item>Value</item>
</include>
<instockonly>true</instockonly>
<statistics>true</statistics>
</report>
While somewhat verbose, this could be validated if desired, and would be stored in the reports table as a simple string. On retrieval, it could be inserted in the web page as a document and manipulated with the standard JavaScript functions for dealing with such objects. The surrounding report element is somewhat redundant in that this is being stored in a reports table, but is necessary for it to be valid XML.
Producing Reports
We have covered the syntax of a stored report pretty well, but it is time to look at the semantics. We know what a report specification looks like, but what can you do with it? Again, in the real world this will be driven by your business model. But we can give some simple examples of how database contents can be analyzed and presented in tabular form. These can then be displayed on a web page, downloaded to a spreadsheet, or both.
As always, there are design decisions to be made. As in any client-server system, some work is best (or necessarily) performed in one part of the system, but both will be involved. Since the database is on the server, we will assume in this example that most of the work is performed there in PHP, and that the result will be delivered to the client for display. But a good deal of the display work could be done on the client side in JavaScript. If this is an interactive web app, this will almost certainly be the case.
There are two parts to this data manipulation - retrieving the raw data that will appear in the displayed table, and arranging it according to the specified report format. Judicious use of SQL clauses can ease this task somewhat, asking the database to do some of the arranging for you. Also, retrieving only what you need for the report will make things go much faster, especially if the volume of data is significant.
The first thing the program should do, then, is to look at the report specification and use it to build the SQL query. It is outside the scope of this discussion to address narrowing the scope of the query, other than to say that it is almost certain to happen. This may be either part of the report specification itself (e.g., show only wines in stock vs. show all wines) or it may be in addition to the report specification. If your business model is based on appointments, then the user will probably want to specify a date range of interest through some web app mechanism. But this is not going to be part of the report specification, since it will be different for every run of the report.
You will use the report specification to select which fields to retrieve from the database, and perhaps also to order them. What the server code does is dynamically build a SQL query by using pieces of text that are part of every request (like table names), pieces of text that are based on the report specification, and other user inputs received from the client. These are all put together into one query and fired off to the database server, which then returns a record set that will be used to populate the report table. That, of course, happens in accordance with the specification for this report.
If you look back at the report specification GUI earlier in this article, you may note that the GroupBy drop down list is short - it only allows two levels of grouping. Certainly, your database can use an ORDER BY clause to group things arbitrarily deeply. But it is probably not good design practice to allow more than one or two levels of grouping. The idea here is that the name of the group is used exactly once, and appears on a line by itself. In contrast, the OrderBy is used only for sorting. It's name is not broken out on a line by itself, but is repeated for every line. Take a look at the wine list report fragment above. You can see that Meritage, which is a Varietal and part of the GroupBy clause, is on a line by itself. All the lines below it (until the next varietal) are all Meritage wines, but we don't want to repeat that. On the other hand, the Pinot Noir category has one wine from 2003 followed by three wines from 2004. The vintage year is an OrderBy category, and does get repeated.
Of course, your result set as delivered by the database will repeat everything - it contains all fields in each record. So your processing requires that you watch for changes in the GroupBy columns. When you see one, you emit a new group header line. You then output the first item to display all the OrderBy and Include fields. You then continue reading rows from the result set. So long as the GroupBy values don't change, you can just ignore them and output the rest of the display information. Only when you see a change to you have to output a new GroupBy header line.
If you choose to produce the final result table on the server, you need to worry about formatting, alignment, use of color, font size, and so on. As always, there are choices to be made. You can simply define a standard and say that all reports will conform to this hard-coded set of rules. Or, you can give the user some control over how the report looks by making it part of the report specification. On the other hand, you can control formatting on the client side and let HTML rendering do much of the work for you. If you are planning on downloading results to a spreadsheet, you don't need to worry about formatting at all, since the spreadsheet program will let the user take care of that.